Pelli-Robson Contrast Sensitivity Test: How It Works, Scoring, Clinical Uses, and Limits
The Pelli-Robson contrast sensitivity test is one of the most widely used clinical tools for measuring how well a person sees low-contrast detail. Unlike a standard eye chart, which mainly tests whether very small high-contrast letters can be resolved, the Pelli-Robson chart tests how faint a large letter can become before it disappears into the background.1
Editorial Methodology
This article was editorially reviewed and rigorously fact-checked against primary and high-trust medical sources, including StatPearls, the National Eye Institute, the original Pelli-Robson design paper, official chart instructions, and peer-reviewed ophthalmology literature cited below.
Key Takeaways
- Pelli-Robson results are reported on a logarithmic contrast scale, with each triplet changing by 0.15 log units.
- The test complements Snellen visual acuity because it measures visibility of low-contrast detail, not just the ability to resolve very small high-contrast letters.
- It is clinically useful in conditions such as glaucoma and cataract, where patients may report washed-out or foggy vision despite relatively preserved high-contrast acuity.
What the Pelli-Robson contrast sensitivity test measures
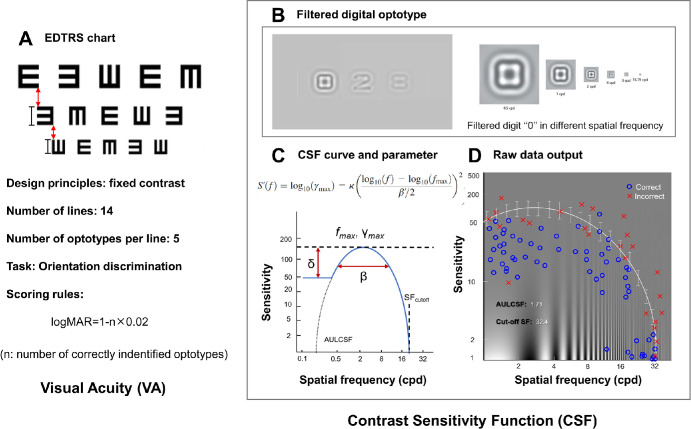
Visual acuity and contrast sensitivity are related, but they are not the same thing. A person can read high-contrast black letters on a white chart reasonably well and still struggle in the situations that matter most in daily life: seeing faces in dim light, detecting a curb edge in fog, reading pale text, or driving at night. That gap is why contrast sensitivity testing remains clinically important. Contrast sensitivity measures the ability to detect small differences in luminance between an object and its background, whereas standard acuity testing mainly asks whether very small, high-contrast detail can be resolved. In other words, acuity measures size limits under ideal contrast; contrast sensitivity measures visibility when contrast is poor.16
How the Pelli-Robson chart works
The Pelli-Robson contrast sensitivity test became influential because it brought this concept into routine clinical practice in a simple chart format. In the original design paper, Denis Pelli, John Robson, and Arnold Wilkins argued that a practical clinic test should resemble familiar letter charts rather than laboratory grating experiments. Their solution was elegant: keep the letters large and constant in size, but progressively reduce their contrast instead.2 That design makes the test fast, intuitive, and clinically useful for detecting losses that may be missed by acuity alone.
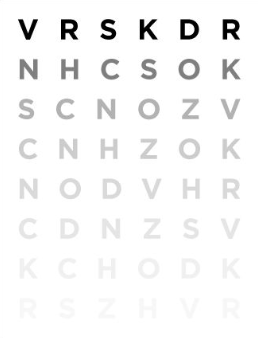
A standard Pelli-Robson chart uses Sloan letters arranged in triplets. Each group of three letters has the same contrast, and each successive triplet is lower in contrast than the one before it. Modern instructions specify a viewing distance of about 1 meter, best distance correction, careful control of chart illumination, and avoidance of glare. The recommended luminance of the white background is about 85 cd/m², with an acceptable range of 60 to 120 cd/m².3 Those details matter because contrast sensitivity is highly sensitive to test conditions. A chart that is dimly lit, unevenly illuminated, or viewed from the wrong distance is not measuring the same thing as a properly standardized examination.
Pelli-Robson chart scoring and interpretation
In ordinary clinical use, the patient reads across the chart from the highest-contrast letters toward the faintest ones. Standard Pelli-Robson instructions say not to stop too early; the patient should continue guessing until two of the three letters in a triplet are missed. The score is then assigned from the faintest triplet in which at least two letters were identified correctly.3 Because the contrast steps are logarithmic, the result is reported as log contrast sensitivity, usually on a scale that runs from very poor performance near 0.00 to excellent performance around 2.25. Each triplet differs by 0.15 log units, which makes the score clinically interpretable and practical for follow-up testing.12
This scoring system is one reason the Pelli-Robson chart has lasted. It is not just easy to administer; it is also reasonably repeatable. In a classic reliability study, Elliott and colleagues found that scores were repeatable to within about ±0.15 log units, or roughly one contrast step, and suggested that a change of about 0.30 log units is more likely to represent a clinically meaningful shift rather than ordinary test-retest noise.4 That does not make the chart perfect, but it gives clinicians a realistic sense of what amount of change deserves attention.
Normal values are also not completely fixed across age groups. In a normative study summarized in PubMed, mean monocular Pelli-Robson results ranged from about 1.84 log units in adults aged 20 to 39 years to about 1.68 log units in adults aged 60 years and older.5 Binocular values are often slightly better than monocular values, and the official instructions note that binocular log contrast sensitivity is normally about 0.15 higher than monocular performance.3 This age effect matters because an older patient may report “foggy” or washed-out vision even when their high-contrast acuity still looks good on paper.
Clinical uses of the contrast sensitivity eye test
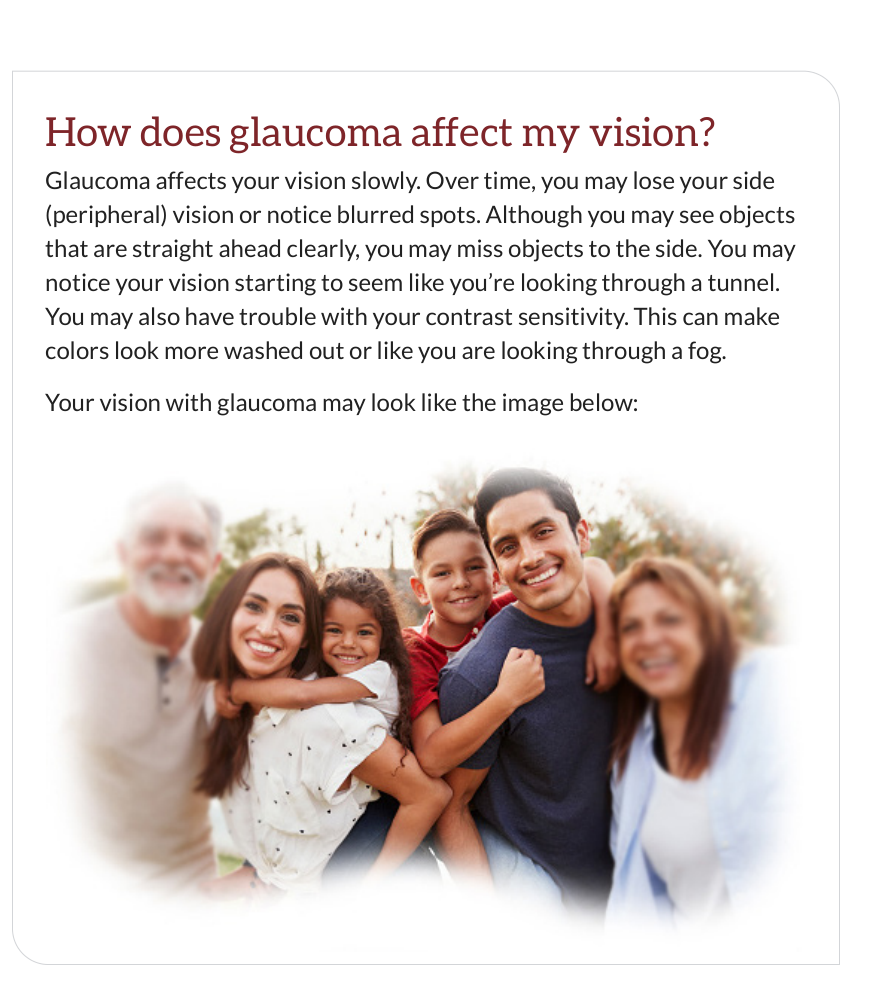
Clinically, the value of contrast sensitivity testing is that it captures aspects of visual function closer to real-world performance. Reviews and comparative studies have linked reduced contrast sensitivity to problems with driving, reading, and navigation, and have noted its usefulness in conditions such as glaucoma, cataract, and optic neuritis.16 The National Eye Institute’s patient information on glaucoma also describes reduced contrast sensitivity as a reason colors may look washed out or vision may seem foggy, even before a patient can clearly describe the change.7 The important point is that poor contrast sensitivity is not specific to one disease. It is a functional sign that can arise from many ocular and neurologic problems, which is why the test is best understood as part of a broader eye examination rather than as a stand-alone diagnosis.
Limits of the Pelli-Robson test
At the same time, the Pelli-Robson test has limitations. It samples contrast vision at one optotype size and therefore reflects only part of the full contrast sensitivity function, not the entire range of spatial vision. Newer quantitative tests can measure contrast sensitivity across multiple spatial frequencies, which is useful in research and in some specialized clinical settings.8 The Pelli-Robson chart also depends on letter recognition, so literacy, attention, and cognition can influence results. In pediatric or low-literacy settings, other contrast tests may be more suitable.6 None of this makes the Pelli-Robson chart obsolete; it simply defines what it does well and what it does not do.
Can a free online contrast sensitivity test replace a clinical chart?
These limitations are especially relevant when contrast sensitivity is measured on screens. Online and tablet-based tests can be useful for screening, remote follow-up, or rough self-monitoring, but they are not automatically equivalent to a calibrated clinical chart. Comparative studies have shown that tablet-based contrast sensitivity testing can correlate with gold-standard methods, yet agreement is imperfect, and some electronic systems perform less well at very low contrast levels.610 That is not surprising. Screen luminance, anti-glare coatings, brightness settings, browser zoom, viewing distance, ambient light, and panel technology all affect what the user actually sees. A free online contrast sensitivity test can therefore be informative, but its strongest use is as a structured screening tool or a consistency-based self-check, not as a substitute for a standardized office measurement.
Conclusion
The best scientific way to frame the Pelli-Robson contrast sensitivity test is this: it is a robust, clinically proven method for measuring how faint a large letter can be before it disappears into the background. It complements visual acuity rather than replacing it. When performed under standardized conditions, it can reveal meaningful functional loss, track change over time, and explain symptoms that ordinary acuity testing may miss. When adapted to digital platforms, it remains useful, but only if its clinical assumptions about distance, luminance, contrast calibration, and interpretation are respected. That combination of simplicity, physiologic relevance, and practical repeatability is why the Pelli-Robson chart still matters.
References
- Kaur K, Gurnani B. Contrast Sensitivity. StatPearls. Updated 2023. National Center for Biotechnology Information. Available at: https://www.ncbi.nlm.nih.gov/books/NBK580542/
- Pelli DG, Robson JG, Wilkins AJ. The design of a new letter chart for measuring contrast sensitivity. Clinical Vision Sciences. 1988;2:187–199. PDF available at: https://visualstress.info/1988-72.pdf
- Pelli D, Robson J. The Pelli-Robson Chart Instructions. Precision Vision; 2013. Available at: https://kaypictures.co.uk/wp-content/uploads/2022/04/Pelli-R.pdf
- Elliott DB, Bullimore MA, Bailey IL. The reliability of the Pelli-Robson contrast sensitivity chart. Ophthalmic Physiol Opt. 1990. PubMed: https://pubmed.ncbi.nlm.nih.gov/2330208/
- Mäntyjärvi M, Laitinen T. Normal values for the Pelli-Robson contrast sensitivity test. J Cataract Refract Surg. 2001. PubMed: https://pubmed.ncbi.nlm.nih.gov/11226793/
- Thayaparan K, Crossland MD, Rubin GS. Clinical assessment of two new contrast sensitivity charts. Br J Ophthalmol. 2007;91(6):749–752. Available at: https://pmc.ncbi.nlm.nih.gov/articles/PMC1955579/
- National Eye Institute. Glaucoma: What You Need to Know. NIH; 2023. Available at: https://www.nei.nih.gov/sites/default/files/2023-08/Glaucoma_WhatYouNeedToKnow_508c.pdf
- Liu J, Huang C, et al. Novel quantitative contrast sensitivity function enhances the prediction of treatment outcome and recurrence in amblyopia. Invest Ophthalmol Vis Sci. 2024;65(5):31. Available at: https://pmc.ncbi.nlm.nih.gov/articles/PMC11114618/
- EyeWiki. Pediatric Low Vision. Figure showing Pelli Robson chart. Available at: https://eyewiki.org/Pediatric_Low_Vision
- Varadaraj V, Assi L, et al. Evaluation of tablet-based tests of visual acuity and contrast sensitivity in older adults. Transl Vis Sci Technol. 2020. PubMed: https://pubmed.ncbi.nlm.nih.gov/33185485/
Test Your Sensitivity
Ready to measure your own visual threshold? Our laboratory-grade Pelli-Robson engine allows you to benchmark your contrast sensitivity against global standards in under 5 minutes.